
Millets and Sorghum
Production Trends
Global Millet Production in 2018
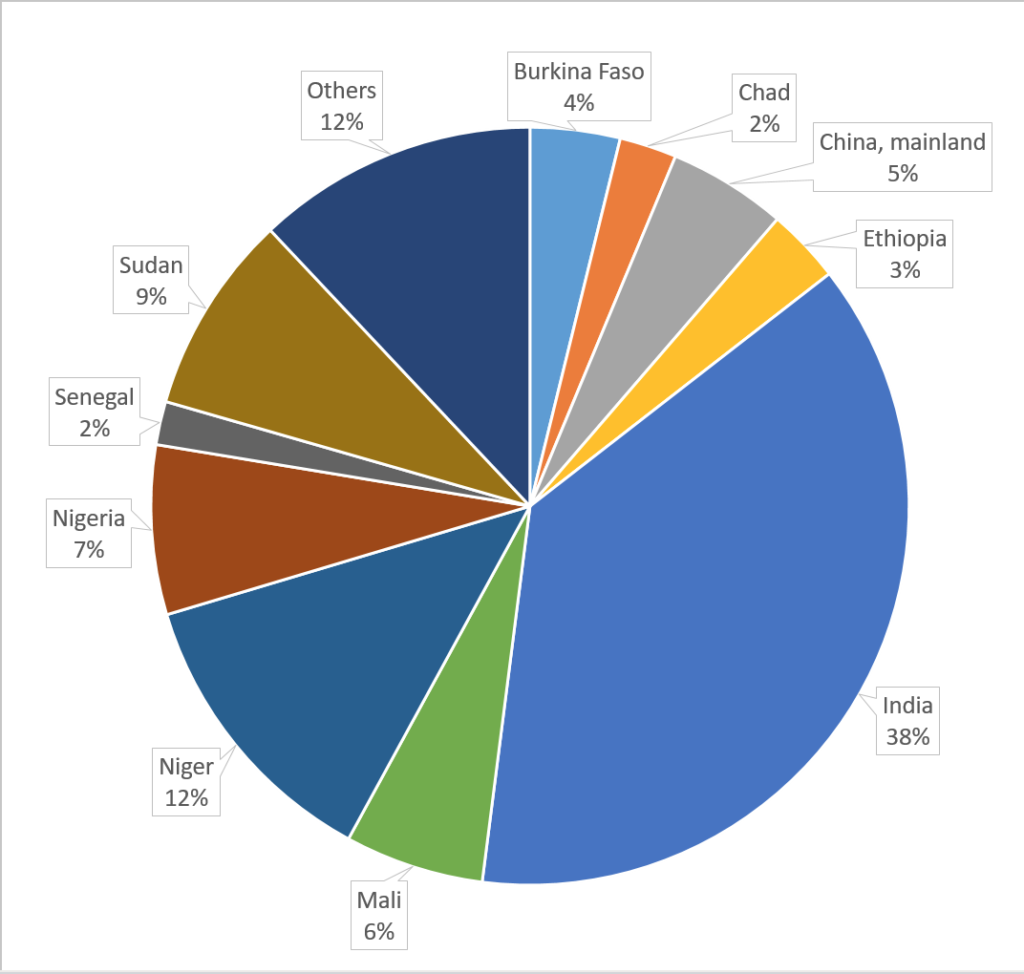
Major Millet Producing Countries (Per cent)
Country-wise Production of Millets (in Tonnes)
|
Country |
Production |
|
India |
11,640,000 |
|
Niger |
3,856,344 |
|
Sudan |
2,647,000 |
|
Nigeria |
2,240,744 |
|
Mali |
1,840,321 |
|
China, mainland |
1,565,965 |
|
Burkina Faso |
1,189,079 |
|
Ethiopia |
982,958 |
|
Chad |
756,616 |
|
Senegal |
574,000 |
|
Country |
Production |
|
United Republic of Tanzania |
327,467 |
|
United States of America |
326,340 |
|
Nepal |
313,987 |
|
Myanmar |
247,895 |
|
Russian Federation |
217,200 |
|
Guinea |
214,747 |
|
Uganda |
209,979 |
|
Others* |
1,868,728 |
|
Total |
31,019,370 |
*Others: Ghana, Cameroon, Gambia, Kenya, Namibia, Ukraine, Democratic People’s Republic of Korea, Côte d’Ivoire, Yemen, Angola, Sierra Leone, France, …..
Compiled by Smart Food from FAO Data http://www.fao.org/faostat/en/#data/QC
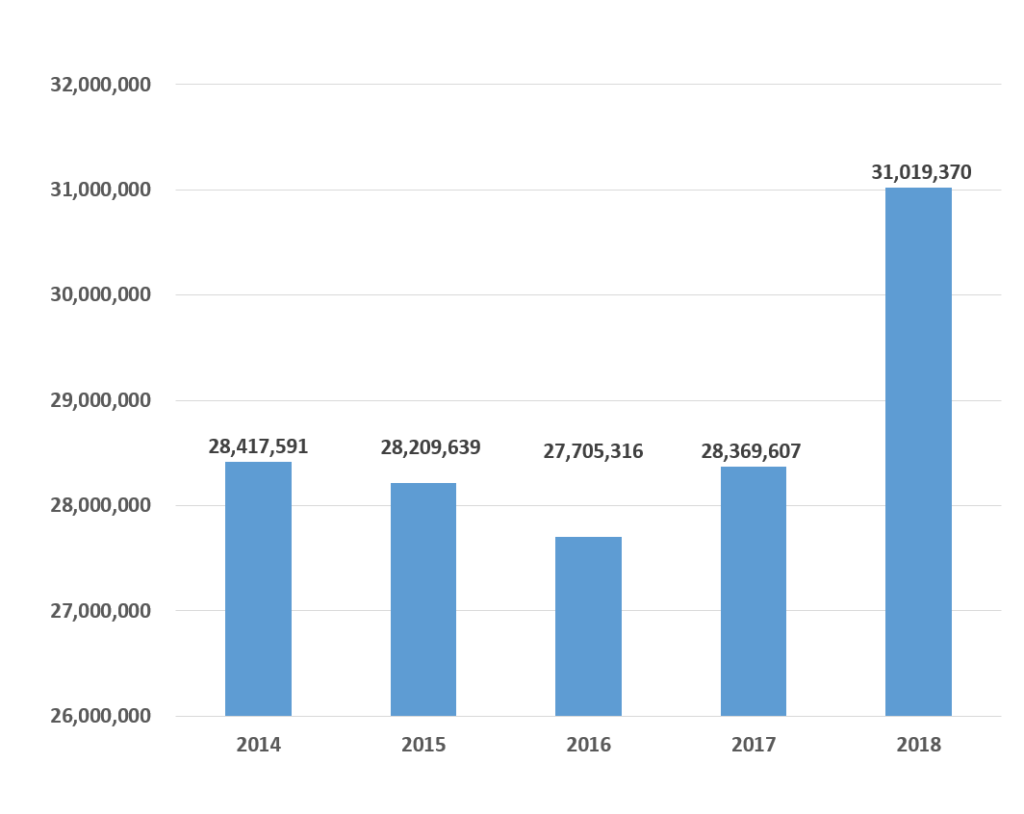
Global Millet Production Trend from 2014 to 2018
|
Year |
Production |
|
2014 2015 2016 2017 2018 |
28,417,591 28,209,639 27,705,316 28,369,607 31,019,370 |
Compiled by Smart Food from FAO Data http://www.fao.org/faostat/en/#data/QC
Global Sorghum Production in 2018
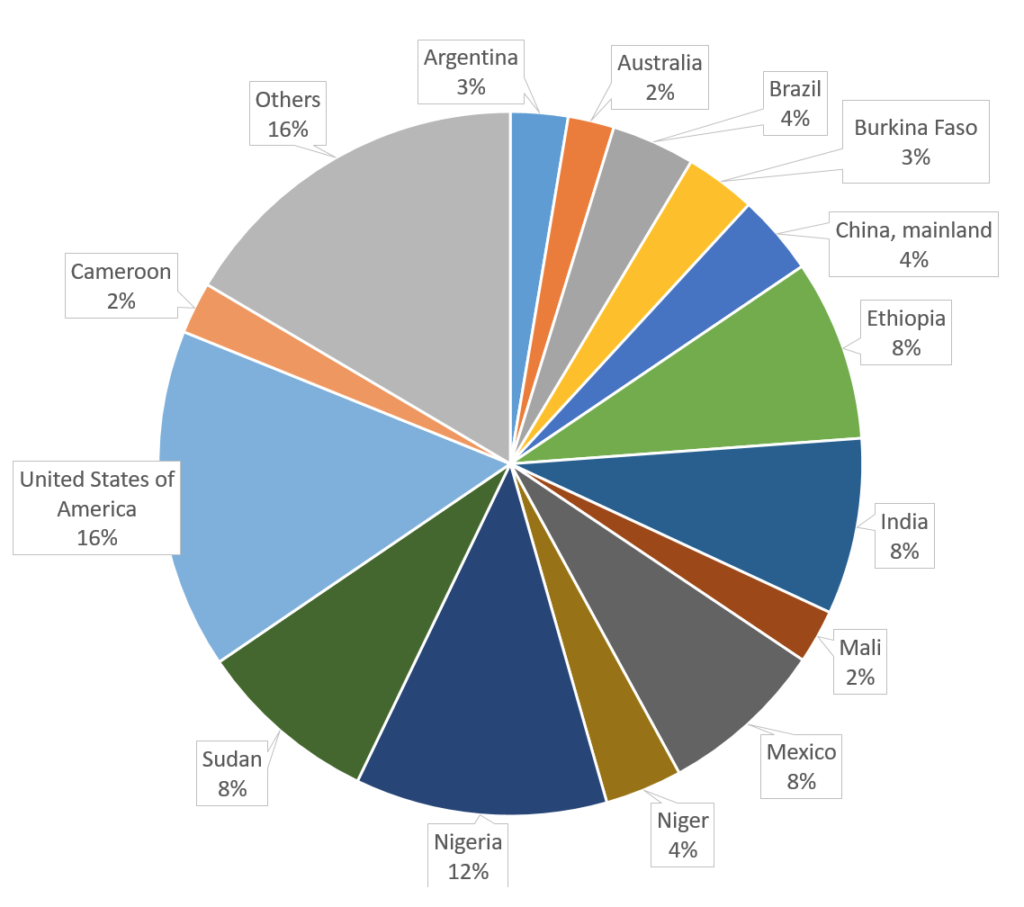
Major Sorghum Producing Countries (Per cent)
Country-wise Sorghum Production (in Tonnes)
|
Country |
Production
|
|
United States of America |
9,271,070 |
|
Nigeria |
6,862,343 |
|
Sudan |
4,953,000 |
|
Ethiopia |
4,932,408 |
|
India |
4,800,000 |
|
Mexico |
4,531,097 |
|
Brazil |
2,272,939 |
|
China, mainland |
2,192,032 |
|
Niger |
2,100,190 |
|
Burkina Faso |
1,929,834 |
|
Country |
Production
|
|
Argentina |
1,563,445 |
|
Mali |
1,469,688 |
|
Cameroon |
1,416,116 |
|
Australia |
1,257,219 |
|
Bolivia |
1 ,023,314 |
|
Chad |
987,558 |
|
Egypt |
843,263 |
|
United Republic of Tanzania |
808,541 |
|
Others* |
6,128,046 |
|
Total |
59,342,103 |
*Others: South Sudan, France, Benin, Ghana, Uganda, Italy, Togo, Yemen, Myanmar, Kenya, Ukraine, Rwanda, Pakistan, Saudi Arabia, Senegal, Eritrea, Somalia, South Africa, El Salvador, …..
Compiled by Smart Food from FAO Data http://www.fao.org/faostat/en/#data/QC
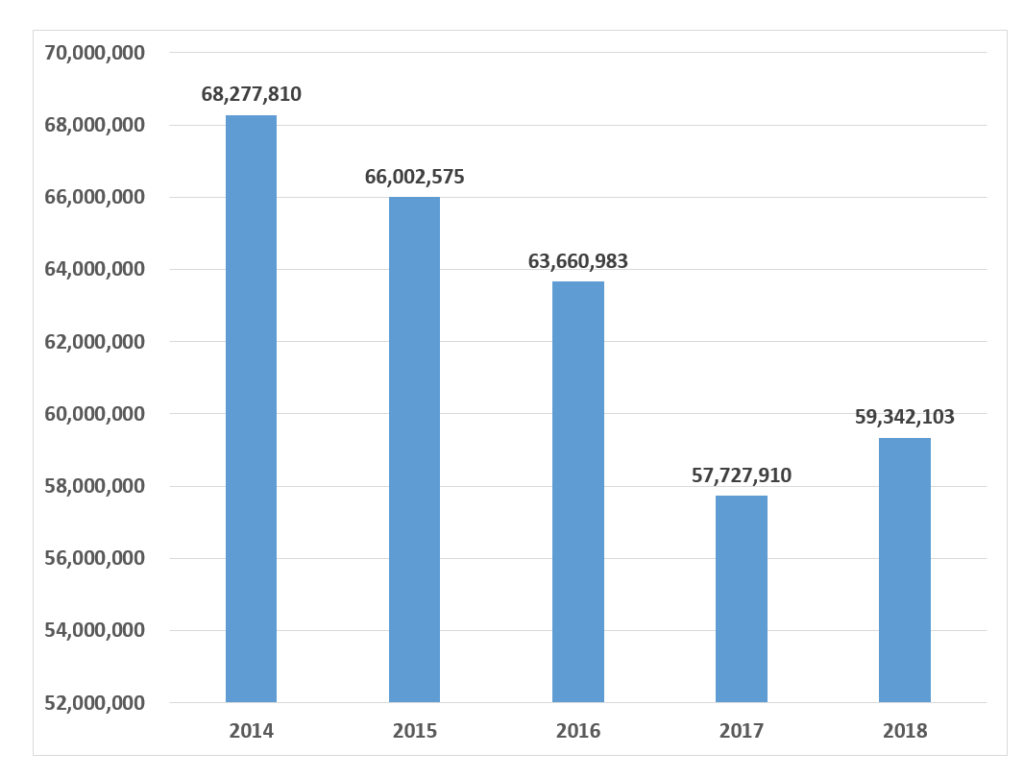
Global Sorghum Production Trend from 2014 to 2018
|
Year |
Production |
|
2014 2015 2016 2017 2018 |
68,277,810 66,002,575 63,660,983 57,727,910 59,342,103 |
Compiled by Smart Food from FAO Data http://www.fao.org/faostat/en/#data/QC
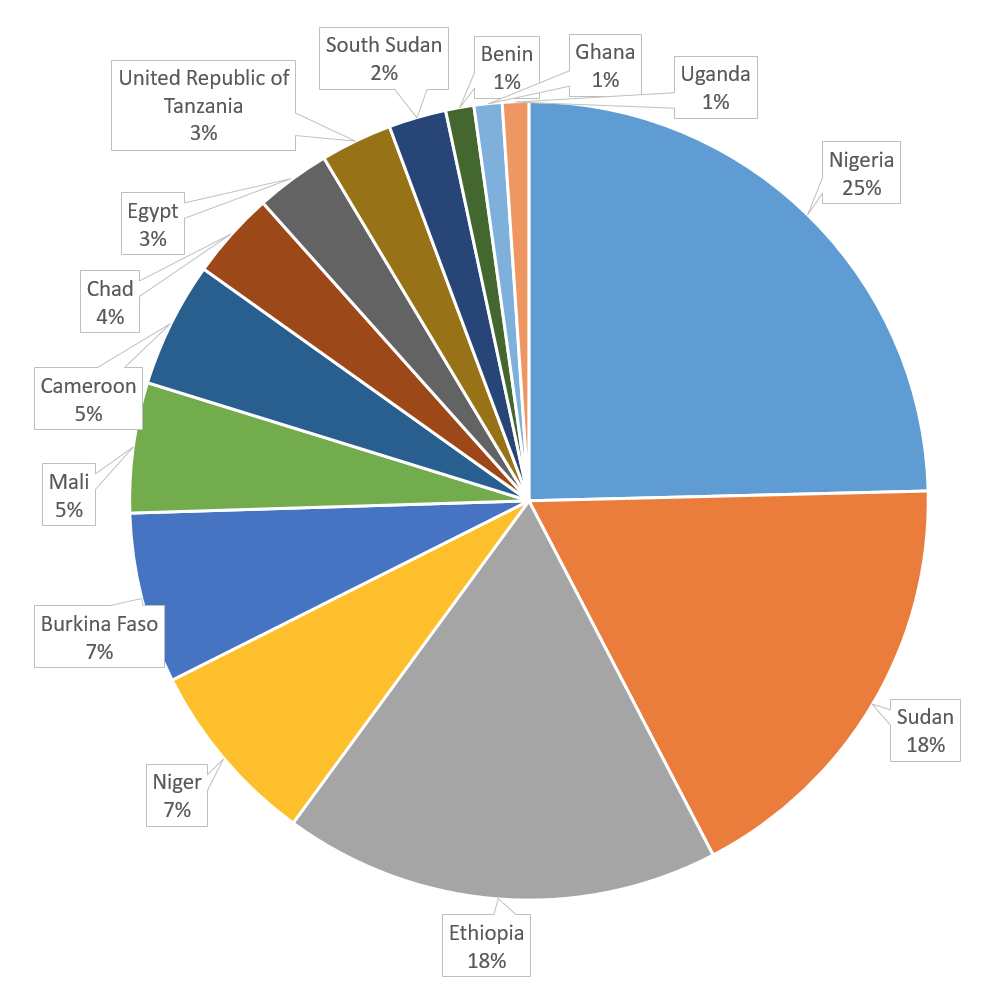
Africa Millet Production in 2018

Compiled by Smart Food from FAO Data http://www.fao.org/faostat/en/#data/QC
Country-wise Millet Production in Africa (in Tonnes)
|
Country |
Production (Tonnes) |
|
Nigeria |
6,862,343 |
|
Sudan |
4,953,000 |
|
Ethiopia |
4,932,408 |
|
Niger |
2,100,190 |
|
Burkina Faso |
1,929,834 |
|
Mali |
1,469,688 |
|
Cameroon |
1,416,116 |
|
Chad |
987,558 |
|
Egypt |
843,263 |
|
Country |
Production |
|
United Republic of Tanzania |
808,541 |
|
South Sudan |
650,000 |
|
Benin |
319,175 |
|
Ghana |
316,236 |
|
Uganda |
298,252 |
|
Togo |
277,240 |
|
Kenya |
206,234 |
|
Others* |
1,412,328 |
|
Total |
28,782,406 |
*Others: Côte d’Ivoire, Angola, Sierra Leone, Democratic Republic of the Congo, Zimbabwe, Zambia, Malawi, Benin, Togo, Eritrea, Mozambique, Guinea-Bissau, Congo, Central African Republic, Burundi, Libya, Rwanda, South Africa, South Sudan, Morocco, Mauritania, Botswana.
Compiled by Smart Food from FAO Data : www.fao.org/faostat/en/#data/QC
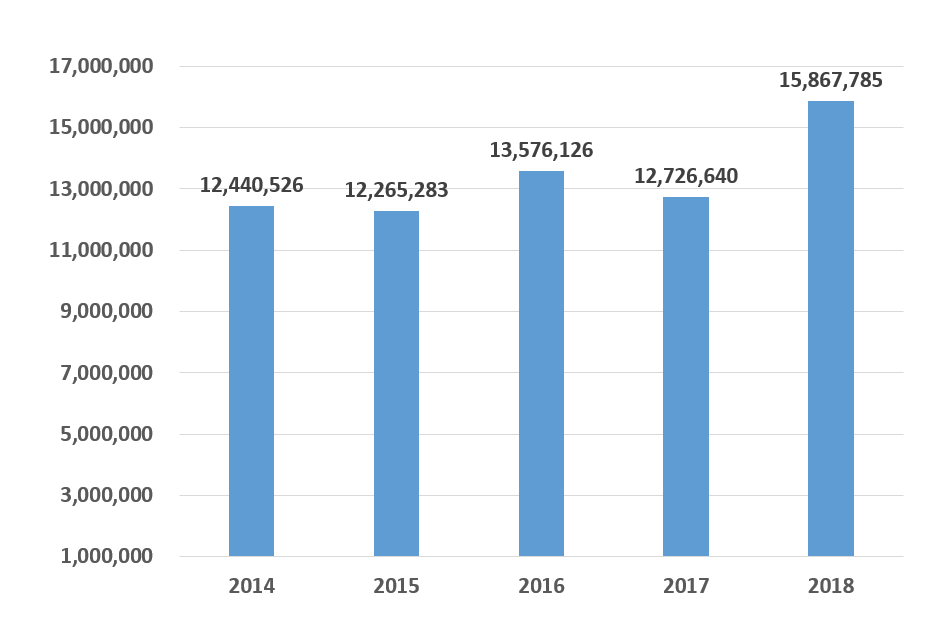
Africa Millet Production Trend from 2014 to 2018
|
Year |
Production |
|
2014 2015 2016 2017 2018 |
12,440,526 12,265,283 13,576,126 12,726,640 15,867,785 |
Compiled by Smart Food from FAO Data : www.fao.org/faostat/en/#data/QC
Africa Sorghum Production in 2018
Compiled by Smart Food from FAO Data http://www.fao.org/faostat/en/#data/QC
Country-wise Sorghum Production in Africa (in Tonnes)
|
Country |
Production (Tonnes) |
|
Nigeria |
6,862,343 |
|
Sudan |
4,953,000 |
|
Ethiopia |
4,932,408 |
|
Niger |
2,100,190 |
|
Burkina Faso |
1,929,834 |
|
Mali |
1,469,688 |
|
Cameroon |
1,416,116 |
|
Chad |
987,558 |
|
Egypt |
843,263 |
|
Country |
Production |
|
United Republic of Tanzania |
808,541 |
|
South Sudan |
650,000 |
|
Benin |
319,175 |
|
Ghana |
316,236 |
|
Uganda |
298,252 |
|
Togo |
277,240 |
|
Kenya |
206,234 |
|
Others* |
1,412,328 |
|
Total |
28,782,406 |
* Others : Rwanda, Senegal, Eritrea, Somalia, South Africa, Mozambique, Malawi, Zimbabwe, Mauritania, Côte d’Ivoire, Angola, Guinea, Sierra Leone, Central African Republic, Gambia, Burundi, Guinea-Bissau, Botswana, Lesotho, Zambia, Democratic Republic of the Congo, Namibia, Algeria, Morocco, Madagascar, Tunisia, Eswatini
Compiled by Smart Food from FAO Data : www.fao.org/faostat/en/#data/QC
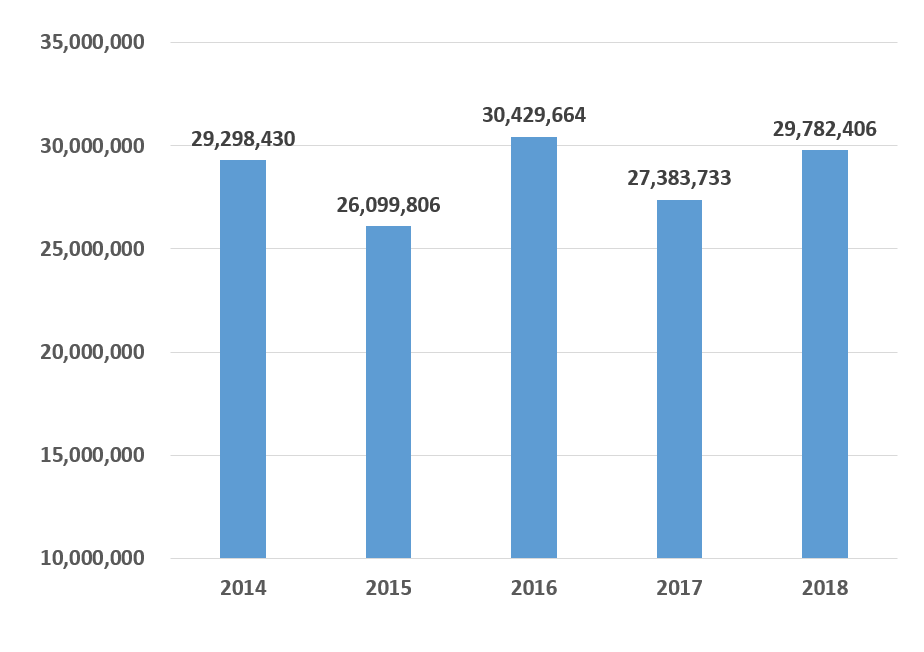
Africa Sorghum Production Trend from 2014 to 2018
|
Year |
Production |
|
2014 2015 2016 2017 2018 |
29,298,430 26,099,806 30,429,664 27,383,733 29,782,406 |
Compiled by Smart Food from FAO Data : www.fao.org/faostat/en/#data/QC
Production of Pearl Millet, Sorghum and Fonio in Senegal (2014 – 2019) in tonnes

| Year | Pearl Millet | Sorghum | Fonio |
| 2013-2014 | 515,365 | 92,029 | 1,488 |
| 2014-2015 | 408,993 | 102,323 | 2,179 |
| 2015-2016 | 749,874 | 188,500 | 3,228 |
| 2016-2017 | 651,236 | 178,028 | 3,757 |
| 2017-2018 | 875,484 | 215,491 | 3,857 |
| 2018-2019 | 897,574 | 295,463 | 3,921 |
Source: Collated by Smart Food from Senegal, DAPSA/MAER (compiled by K Ndiaye/ISRA-CERAAS)
Time series on production of rice, wheat, maize, millets and sorghum in Africa (1960 to 2018, in million tonnes)
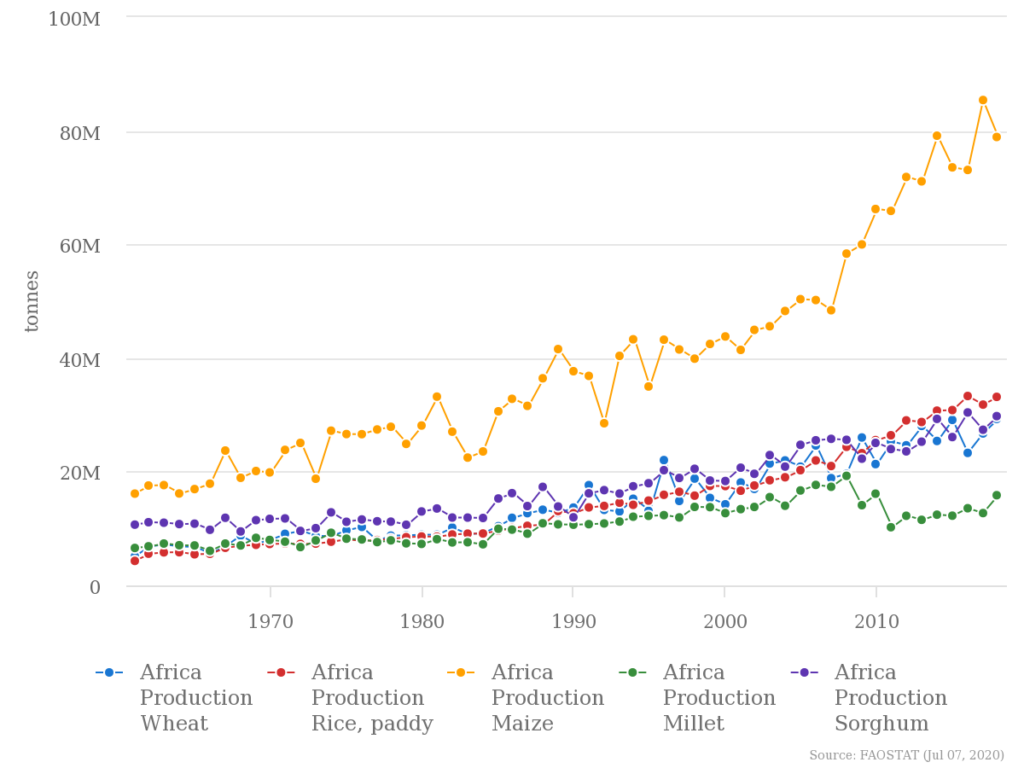
Compiled using FAO STAT compare – http://www.fao.org/faostat/en/#compare
Asia Millet Production in 2018
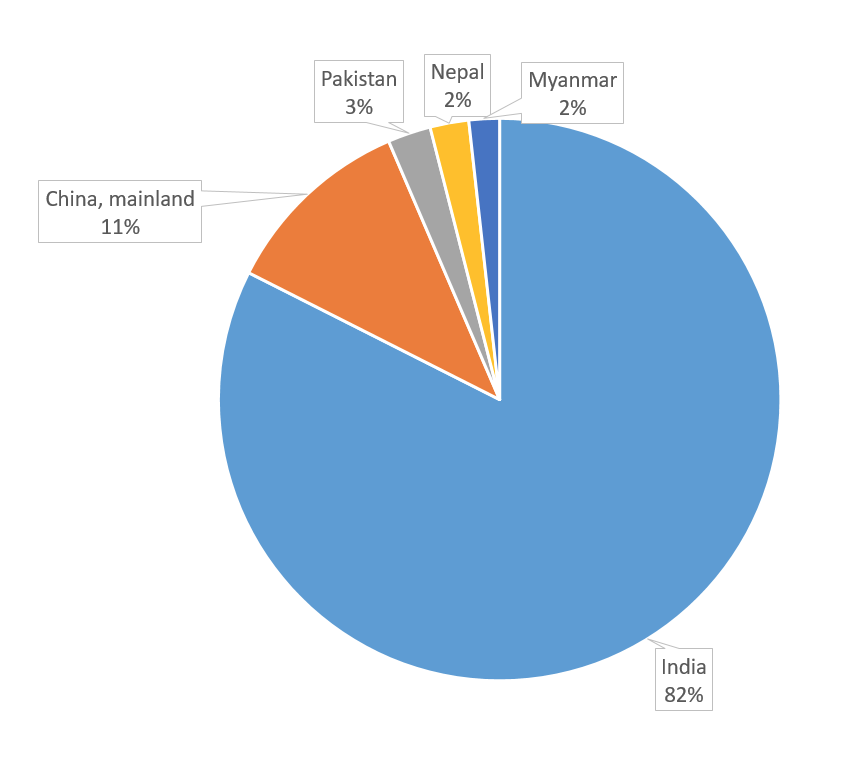
Country-wise Millet Production in Asia (in Tonnes)
|
Country |
Production (Tonnes) |
|
India |
11,640,000 |
|
China, mainland |
1,565,965 |
|
Pakistan |
350,010 |
|
Nepal |
313,987 |
|
Myanmar |
247,895 |
|
Democratic People’s Republic of Korea |
78,486 |
|
Yemen |
57,836 |
|
Kazakhstan |
40,237 |
|
Iran (Islamic Republic of) |
17,573 |
|
Country |
Production |
|
Bangladesh |
12,713 |
|
Afghanistan |
11,640 |
|
Saudi Arabia |
8,320 |
|
Sri Lanka |
8,060 |
|
Uzbekistan |
6,289 |
|
Turkey |
4,397 |
|
Iraq |
4,130 |
|
Others* |
13,780 |
|
Total |
14,381,318 |
*Others : Syrian Arab Republic, Viet Nam, Azerbaijan, Bhutan, Republic of Korea, China, Taiwan Province of, Japan, Kyrgyzstan, Tajikistan, Jordan, Maldives, Turkmenistan
Compiled by Smart Food from FAO Data http://www.fao.org/faostat/en/#data/QC
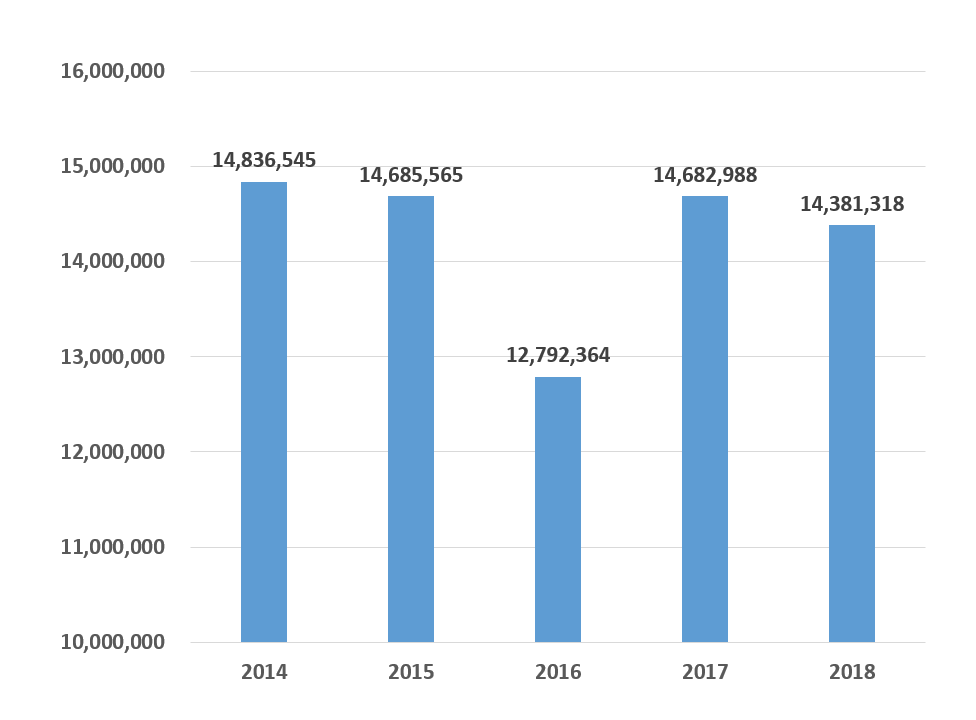
Asia Millet Production Trend from 2014 to 2018
|
Year |
Production |
|
2014 2015 2016 2017 2018 |
14,836,545 14,685,565 12,792,364 14,682,988 14,381,318 |
Compiled by Smart Food from FAO Data http://www.fao.org/faostat/en/#data/QC
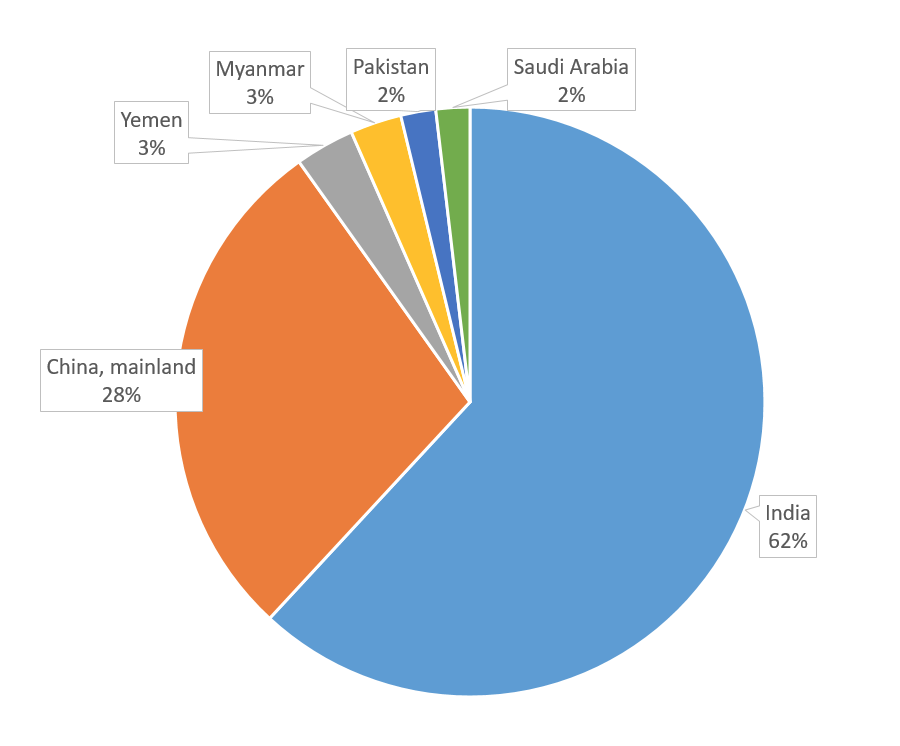
Asia Sorghum Production in 2018
Compiled by Smart Food from FAO Data http://www.fao.org/faostat/en/#data/QC
Country-wise Sorghum Production in Asia (in Tonnes)
|
Country |
Production (Tonnes) |
|
India |
4,800,000 |
|
China, mainland |
2,192,032 |
|
Yemen |
252,324 |
|
Myanmar |
218,392 |
|
Pakistan |
148,729 |
|
Saudi Arabia |
144,038 |
|
Oman |
49,330 |
|
Israel |
47,925 |
|
Democratic People’s Republic of Korea |
35,836 |
|
Country |
Production |
|
Thailand |
34,157 |
|
Iraq |
19,562 |
|
Jordan |
13,431 |
|
Uzbekistan |
7,000 |
|
Republic of Korea |
2,702 |
|
China, Taiwan Province of |
2,329 |
|
Kazakhstan |
2,305 |
|
Others* |
3,696 |
|
Total |
7,973,788 |
*Others : Syrian Arab Republic, Philippines, Lebanon, Palestine, Azerbaijan, Sri Lanka, Tajikistan, Bangladesh, Maldives, Kyrgyzstan, Turkey.
Compiled by Smart Food from FAO Data http://www.fao.org/faostat/en/#data/QC
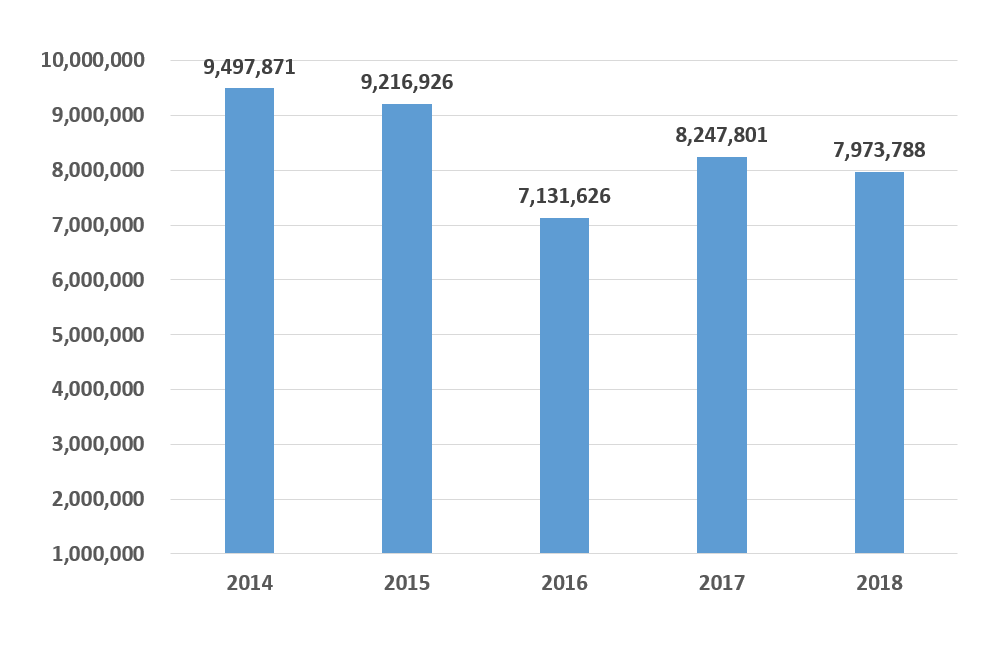
Asia Sorghum Production Trend from 2014 to 2018

|
Year |
Production |
|
2014 2015 2016 2017 2018 |
9,497,871 9,216,926 7,131,626 8,247,801 7,973,788 |
Compiled by Smart Food from FAO Data http://www.fao.org/faostat/en/#data/QC
India Millet Production from 2014 to 2018
|
Year |
Production |
|
2014 2015 2016 2017 2018 |
11,420,000 11,630,000 10,280,000 11,560,000 11,640,000 |
Compiled by Smart Food from FAO Data http://www.fao.org/faostat/en/#data/QC
Crop-wise Production Trend in India (in Million Tonnes)

|
Year |
Sorghum (Jowar) |
Pearl Millet (Bajra) |
Finger Millet (Ragi) |
Small Millets |
|
2014-2015 |
4.24 |
9.18 |
2.06 |
0.386 |
|
2015-2016 |
4.80 |
8.07 |
1.82 |
0.39 |
|
2016-2017 |
4.56 |
9.72 |
13.9 |
0.44 |
|
2017-2018 |
4.66 |
9.26 |
1.96 |
0.42 |
|
2018-2019 |
3.78 |
7.46 |
1.32 |
0.38 |
|
2019-2020 |
4.38 |
8.9 |
1.68 |
0.34 |
|
2022-2023 (Estimate) |
8.50 |
12.3 |
2.89 |
0.805 |
Increase in estimated total production assumed on the basis of increase in area and productivity
Compiled by Smart Food from ICAR-IIMR data
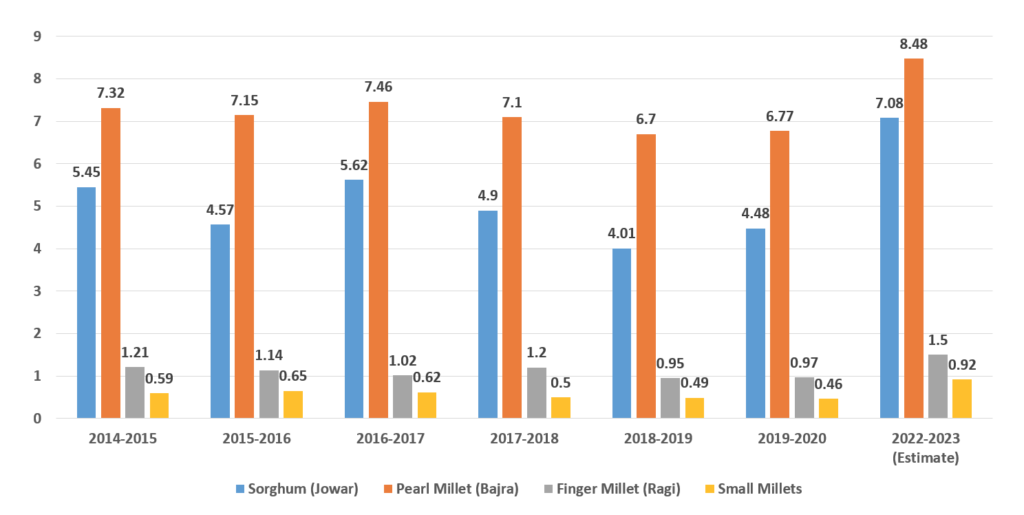
Crop-wise Production Area in India (in Million Hectare)
|
Year |
Sorghum (Jowar) |
Pearl Millet (Bajra) |
Finger Millet (Ragi) |
Small Millets |
|
2014-2015 |
5.45 |
7.32 |
1.21 |
0.59 |
|
2015-2016 |
4.57 |
7.15 |
1.14 |
0.65 |
|
2016-2017 |
5.62 |
7.46 |
1.02 |
0.62 |
|
2017-2018 |
4.90 |
7.10 |
1.20 |
0.50 |
|
2018-2019 |
4.01 |
6.7 |
0.95 |
0.49 |
|
2019-2020 |
4.48 |
6.77 |
0.97 |
0.46 |
|
2022-2023 (Estimate) |
7.08 |
8.48 |
1.50 |
0.92 |
Compiled by Smart Food from ICAR-IIMR data
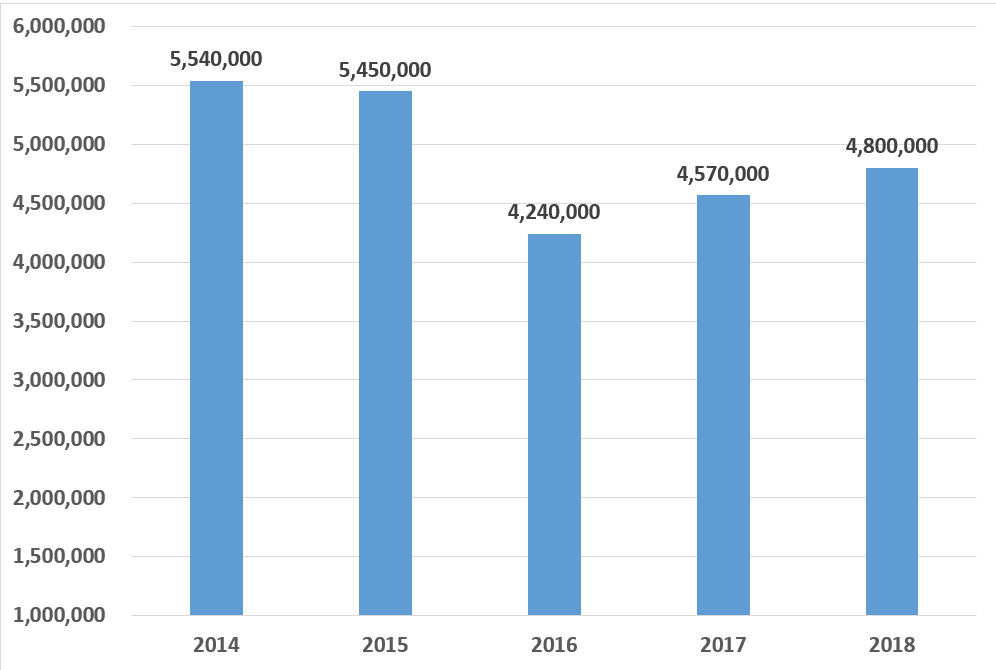
India Sorghum Production from 2014 to 2018
|
Year |
Production |
|
2014 2015 2016 2017 2018 |
5,540,000 5.450,000 4,240,000 4,570,000 4,800,000 |
Compiled by Smart Food from FAO Data http://www.fao.org/faostat/en/#data/QC
India Sorghum Production in million tonnes (by Season)
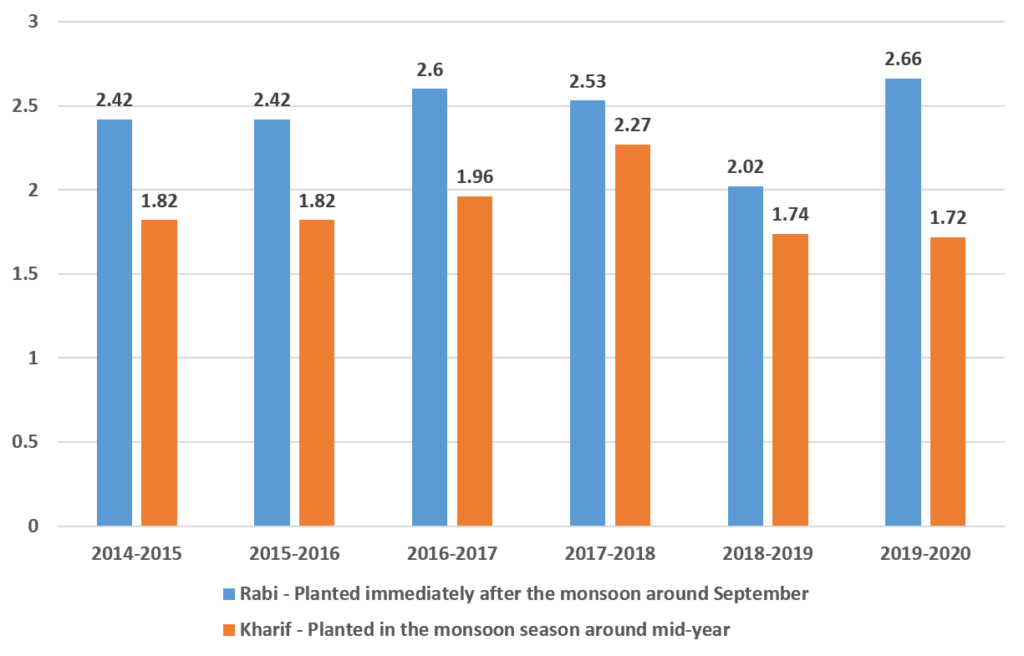
| Year | Rabi | Kharif | Rabi+Kharif |
| 2014-2015 | 2.42 | 1.82 | 4.24 |
| 2015-2016 | 2.42 | 1.82 | 4.24 |
| 2016-2017 | 2.6 | 1.96 | 4.56 |
| 2017-2018 | 2.53 | 2.27 | 4.8 |
| 2018-2019 | 2.02 | 1.74 | 3.76 |
| 2019-2020 | 2.66 | 1.72 | 4.38 |
| Total | 14.65 | 11.33 | 25.98 |
Compiled by Smart Food from ICAR-IIMR data
Major Sorghum Producing States in India 2018 – 2019

|
State |
Production (Million Tonnes) |
| Karnataka |
0.91 |
| Maharashtra |
0.86 |
| Tamil Nadu |
0.49 |
| Rajasthan |
0.47 |
| Andhra Pradesh |
0.35 |
| Madhya Pradesh |
0.31 |
| Uttar Pradesh |
0.18 |
| Gujarat |
0.10 |
| Others* |
0.10 |
| Total |
3.76 |
*Others : Bihar, Chhattisgarh, Haryana, Jammu & Kashmir, Jharkhand, Kerala, Nagaland, Odisha, Telangana, Tripura, West Bengal, D & N Haveli, Delhi
Source: Collated by Smart Food from Agricultural Statistics At a Glance, 2014, Government of India, Ministry of Agriculture, Department of Agriculture & Cooperation
Directorate of Economics & Statistics https://eands.dacnet.nic.in/
India Sorghum Production area in million hectares (by Season)
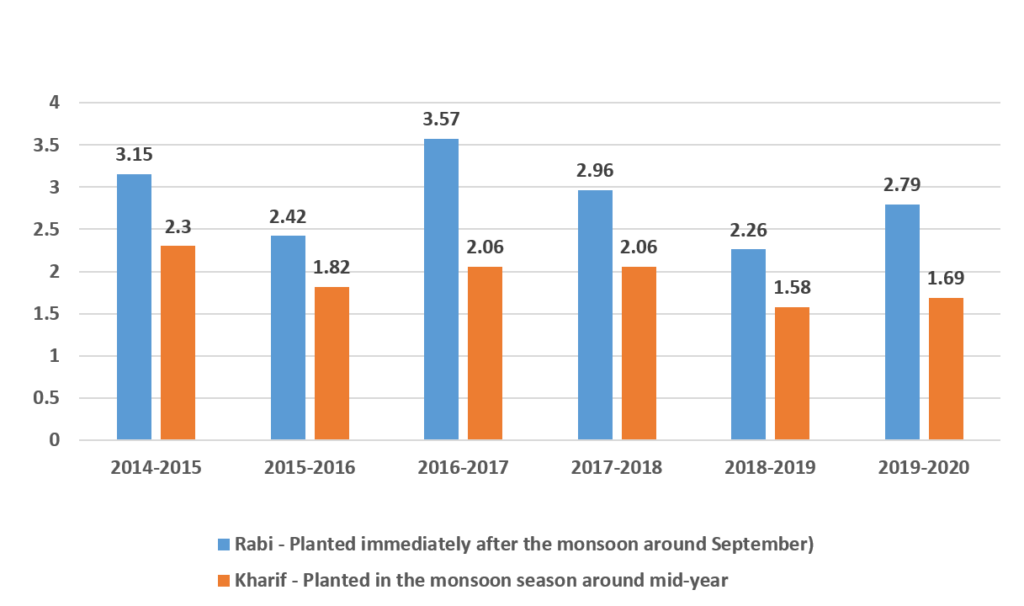
| Year | Rabi | Kharif | Rabi+Kharif |
| 2014-2015 | 3.15 | 2.3 | 5.45 |
| 2015-2016 | 2.42 | 1.82 | 4.24 |
| 2016-2017 | 3.57 | 2.06 | 5.63 |
| 2017-2018 | 2.96 | 2.06 | 5.02 |
| 2018-2019 | 2.26 | 1.58 | 3.84 |
| 2019-2020 | 2.79 | 1.69 | 4.48 |
| Total | 17.85 | 11.51 | 29.36 |
Major Pearl Millet (Bajra) Producing States in India 2018 – 2019

|
State |
Production (Million Tonnes) |
| Rajasthan |
3.81 |
| Uttar Pradesh |
1.78 |
| Haryana |
0.88 |
| Gujarat |
0.83 |
| Madhya Pradesh |
0.63 |
| Maharashtra |
0.31 |
| Karnataka |
0.18 |
| Others* |
0.19 |
| Total |
8.61 |
Others* : Andhra Pradesh, Bihar, Chhattisgarh, Haryana, Himachal Pradesh, Jammu & Kashmir, Jharkhand, Nagaland, Odisha, Punjab, Tamil Nadu, Telangana, West Bengal, Puducherry, Delhi, Daman & Diu
Source: Collated by Smart Food from Agricultural Statistics At a Glance, 2014, Government of India, Ministry of Agriculture, Department of Agriculture & Cooperation
Directorate of Economics & Statistics https://eands.dacnet.nic.in/
Time series on production of rice, wheat, maize, millets and sorghum in India (1960 to 2018, in million tonnes)
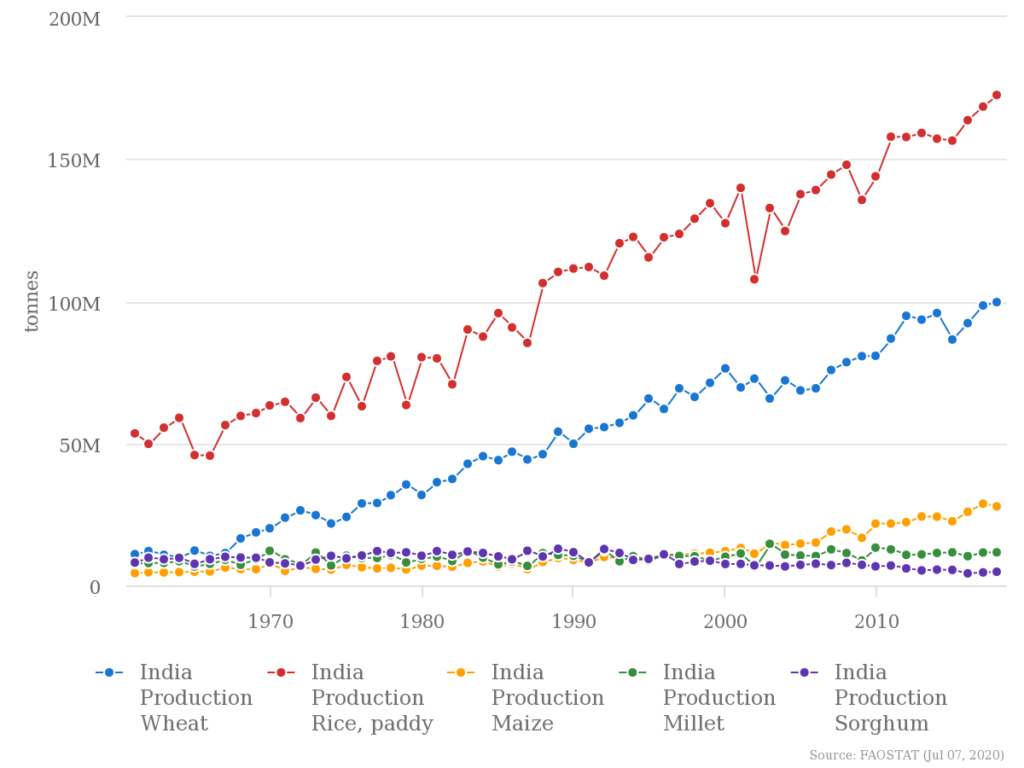
Compiled using FAO STAT compare – http://www.fao.org/faostat/en/#compare
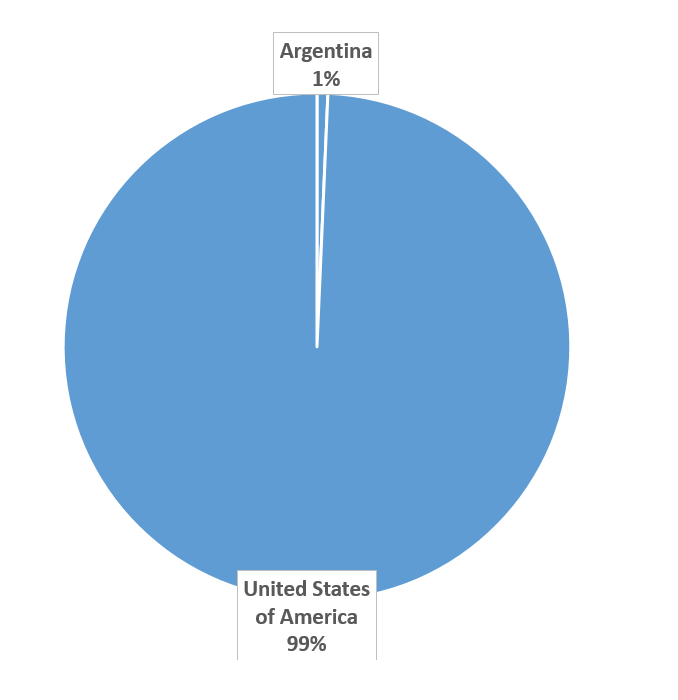
America Millet Production in 2018 (Per cent)
|
Country |
Production (Tonnes) |
|
United States of America |
326,340 |
|
Argentina |
2,254 |
|
Mexico |
221 |
|
Total |
328,815 |
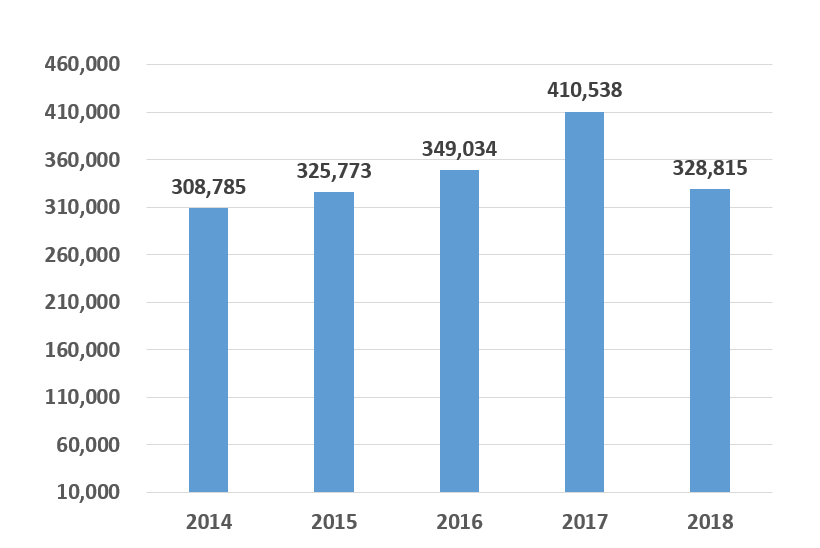
America Millet Production from 2014 to 2018 (in tonnes)
|
Year |
Production |
|
2014 2015 2016 2017 2018 |
308,785 325,773 349,034 410,538 328,815 |
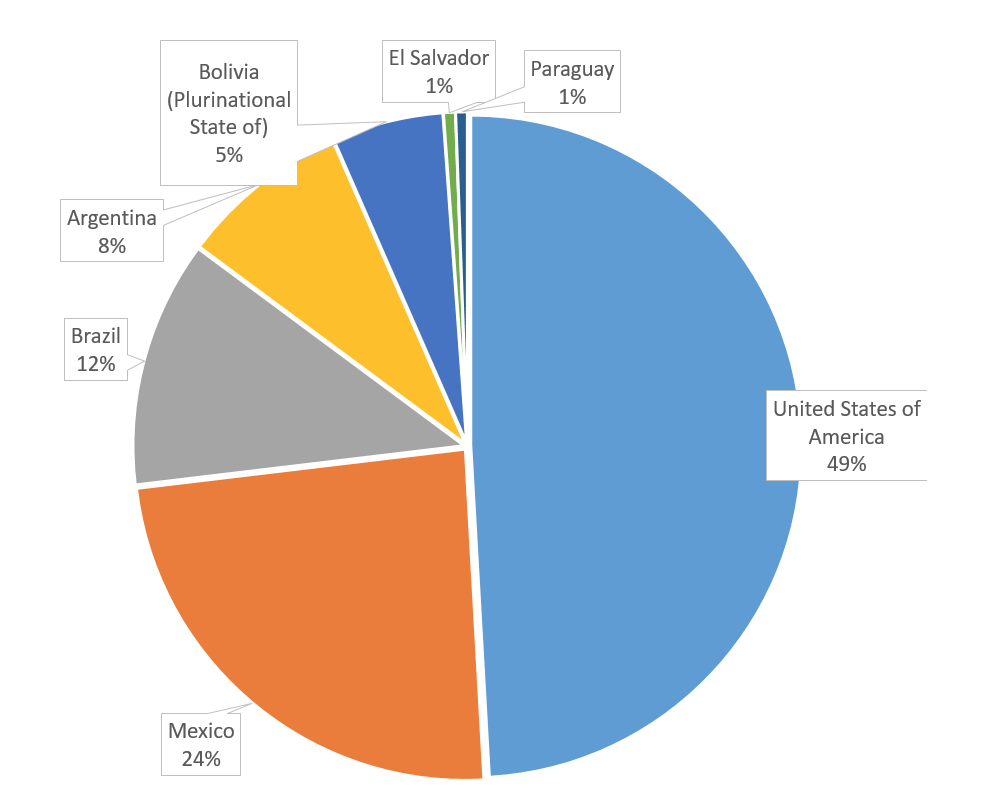
America Sorghum Production in 2018 (Per cent)
|
Country |
Production (Tonnes) |
|
United States of America |
9,271,070 |
|
Mexico |
4,531,097 |
|
Brazil |
2,272,939 |
|
Argentina |
1,563,445 |
|
Bolivia (Plurinational State of) |
1,023,314 |
|
El Salvador |
109,290 |
|
Paraguay |
107,879 |
|
Uruguay |
76,000 |
|
Haiti |
70,000 |
|
Nicaragua |
60,156 |
|
Country |
Production |
|
Guatemala |
49,333 |
|
Venezuela (Bolivarian Republic of) |
37,546 |
|
Honduras |
25,000 |
|
Colombia |
15,515 |
|
Ecuador |
14,988 |
|
Belize |
8,200 |
|
Cuba |
5,595 |
|
Panama |
1,859 |
|
Dominican Republic |
985 |
|
Peru |
209 |
|
Total |
19,244,420 |
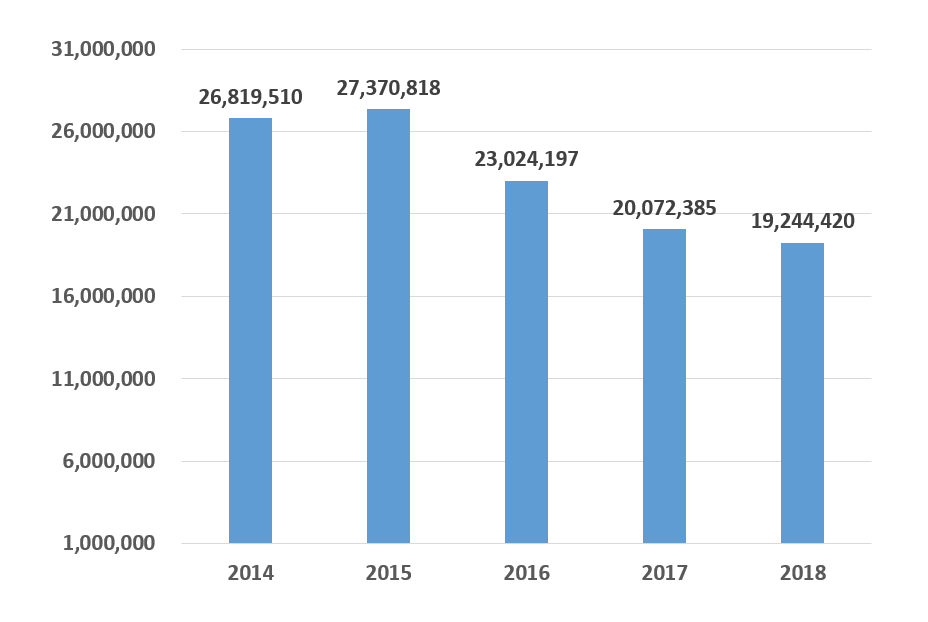
America Sorghum Production from 2014 to 2018 (in Tonnes)
|
Year |
Production |
|
2014 2015 2016 2017 2018 |
26,819,510 27,370,818 23,024,197 20,072,385 19,244,420 |
Top States Producing Small Millets in India 2017-2018

|
State |
Production (‘000 Tonnes) |
| Madhya Pradesh |
144 |
| Uttarakhand |
76 |
| Tamil Nadu |
31.28 |
| Arunachal Pradesh |
27.3 |
| Karnataka |
26.01 |
| Chhattisgarh |
21.13 |
| Maharashtra |
20.83 |
| Andhra Pradesh |
16 |
| Gujarat |
15.73 |
| Odisha |
14.94 |
| Nagaland |
11.7 |
| Rajasthan |
7.34 |
| Uttar Pradesh |
5.85 |
| Bihar |
3.31 |
| Himachal Pradesh |
3.31 |
| Jammu & Kashmir |
3.08 |
| Assam |
3.06 |
| Meghalaya |
2.78 |
| Sikkim |
2.55 |
| West Bengal |
2.2 |
| Tripura |
0.39 |
| Puducherry |
0.19 |
| Total (All India) |
438.99 |
Source: : Collated by Smart Food from Agricultural Statistics At a Glance, 2014, Government of India, Ministry of Agriculture, Department of Agriculture & Cooperation
Directorate of Economics & Statistics https://eands.dacnet.nic.in/
Top Finger Millet (Ragi) Producing states in India (2017-2018)

|
State |
Production (‘000 Tonnes) |
| Karnataka |
1286.03 |
| Tamil Nadu |
321.30 |
| Uttarakhand |
140.80 |
| Maharashtra |
106.49 |
| Andhra Pradesh |
44.70 |
| Odisha |
32.67 |
| Jharkhand |
18.48 |
| West Bengal |
13.56 |
| Gujarat |
10.75 |
| Bihar |
4.19 |
| Himachal Pradesh |
1.92 |
| D & N Haveli |
1.45 |
| Chhattisgarh |
1.21 |
| Telangana |
1.14 |
| Nagaland |
0.33 |
| Puducherry |
0.13 |
| Kerala |
0.11 |
| Total (All India) |
1985.24 |
Source: Collated by Smart Food from Agricultural Statistics At a Glance, 2014, Government of India, Ministry of Agriculture, Department of Agriculture & Cooperation
Directorate of Economics & Statistics https://eands.dacnet.nic.in/
State-wise Pearl Millet (Bajra) Production Area in India (2018-2019)

|
State |
Area (Million Hectares) |
| Rajasthan |
4.18 |
| Uttar Pradesh |
0.88 |
| Haryana |
0.42 |
| Gujarat |
0.40 |
| Madhya Pradesh |
0.26 |
| Maharashtra |
0.50 |
| Karnataka |
0.19 |
| Others* |
0.10 |
| Total |
6.93 |
*Others : Andhra Pradesh, Bihar, Chhattisgarh, Haryana, Himachal Pradesh, Jammu & Kashmir, Jharkhand, Nagaland, Odisha, Punjab, Tamil Nadu, Telangana, West Bengal, Puducherry, Delhi, Daman & Diu
Source: Collated by Smart Food from Agricultural Statistics At a Glance, 2014, Government of India, Ministry of Agriculture, Department of Agriculture & Cooperation
Directorate of Economics & Statistics https://eands.dacnet.nic.in/
State-wise Sorghum (Jowar) Production Area 2018 – 2019

|
State |
Area (Million Hectares) |
| Karnataka |
0.87 |
| Maharashtra |
1.40 |
| Rajasthan |
0.56 |
| Tamil Nadu |
0.38 |
| Andhra Pradesh |
0.16 |
| Uttar Pradesh |
0.15 |
| Madhya Pradesh |
0.14 |
| Gujarat |
0.08 |
| Others |
0.10 |
| Total |
3.84 |
*Others : Bihar, Chhattisgarh, Haryana, Jammu & Kashmir, Jharkhand, Kerala, Nagaland, Odisha, Telangana, Tripura, West Bengal, D & N Haveli, Delhi
Source: Collated by Smart Food from Agricultural Statistics At a Glance, 2014, Government of India, Ministry of Agriculture, Department of Agriculture & Cooperation
Directorate of Economics & Statistics https://eands.dacnet.nic.in/
State-wise Small Millet Production Area in India (2017 – 2018)

|
State |
Area (‘000 Hectares) |
| Madhya Pradesh |
148 |
| Chhattisgarh |
89.47 |
| Uttarakhand |
59 |
| Maharashtra |
42 |
| Karnataka |
34 |
| Odisha |
29.18 |
| Arunachal Pradesh |
26.77 |
| Tamil Nadu |
25.26 |
| Andhra Pradesh |
21 |
| Gujarat |
13 |
| Nagaland |
10.52 |
| Rajasthan |
10.48 |
| Uttar Pradesh |
9 |
| Jammu & Kashmir |
6.19 |
| Assam |
5.23 |
| Bihar |
4.4 |
| Himachal Pradesh |
4.1 |
| Meghalaya |
2.92 |
| West Bengal |
2.7 |
| Sikkim |
2.47 |
| Tripura |
0.49 |
| Kerala |
0.02 |
| All India |
546.20 |
Source: Collated by Smart Food from Agricultural Statistics At a Glance, 2014, Government of India, Ministry of Agriculture, Department of Agriculture & Cooperation
Directorate of Economics & Statistics https://eands.dacnet.nic.in/
State-wise Finger Millet (Ragi) Production Area in India (2018 – 2019)
|
State |
Areaa (‘000 Hectares) |
| Karnataka |
778.00 |
| Uttarakhand |
103.00 |
| Maharashtra |
93.00 |
| Tamil Nadu |
86.51 |
| Odisha |
42.59 |
| Andhra Pradesh |
35.00 |
| Jharkhand |
19.01 |
| Gujarat |
12.00 |
| West Bengal |
12.00 |
| Chhattisgarh |
4.83 |
| Bihar |
4.21 |
| Himachal Pradesh |
1.82 |
| Telangana |
1.00 |
| D & N Haveli |
0.85 |
| Nagaland |
0.34 |
| Kerala |
0.09 |
| Puducherry |
0.05 |
| Total All India |
1194.25 |

Source: Collated by Smart Food from Agricultural Statistics At a Glance, 2014, Government of India, Ministry of Agriculture, Department of Agriculture & Cooperation
Directorate of Economics & Statistics https://eands.dacnet.nic.in/
Time series on production of rice, wheat, maize, millets and sorghum in United States of America (1960 to 2018, in million tonnes)
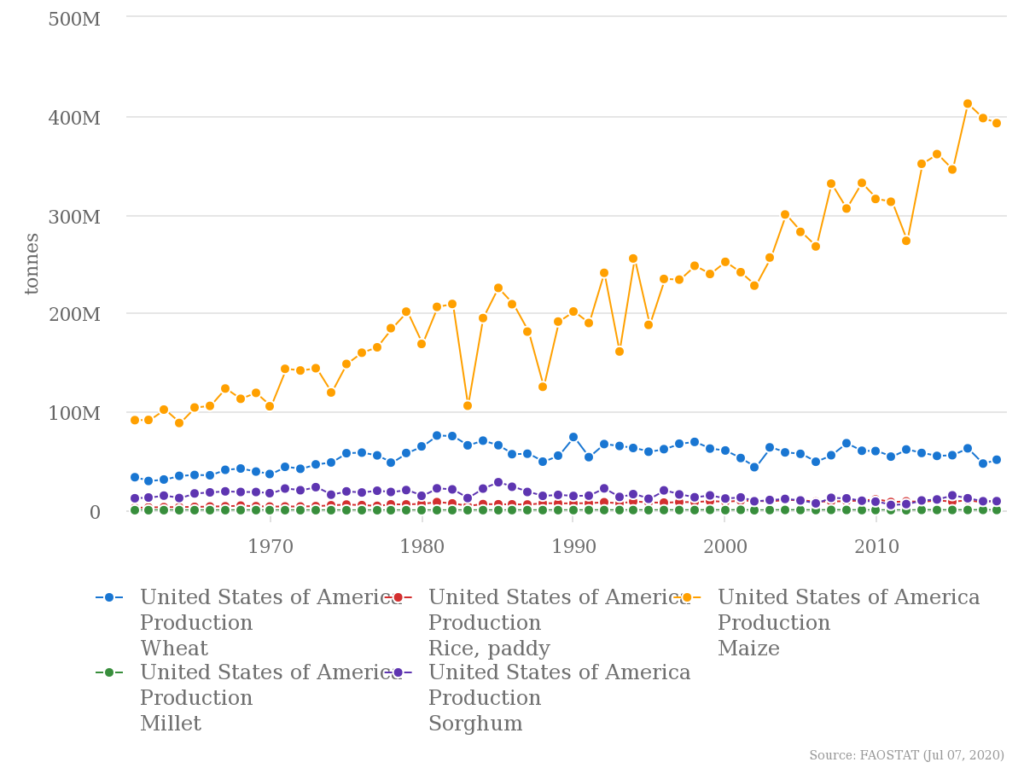
Compiled using FAO STAT compare – http://www.fao.org/faostat/en/#compare